Business Intelligence Case Study: Building Budget, Procurement, and SLA Dashboards
USA
Comprehensive BI transformation for Client using Tableau and Snowflake, enabling real-time financial, procurement, SLA, and AR performance insights


Overview & Strategic Context
Domain: Analytics & Business Intelligence
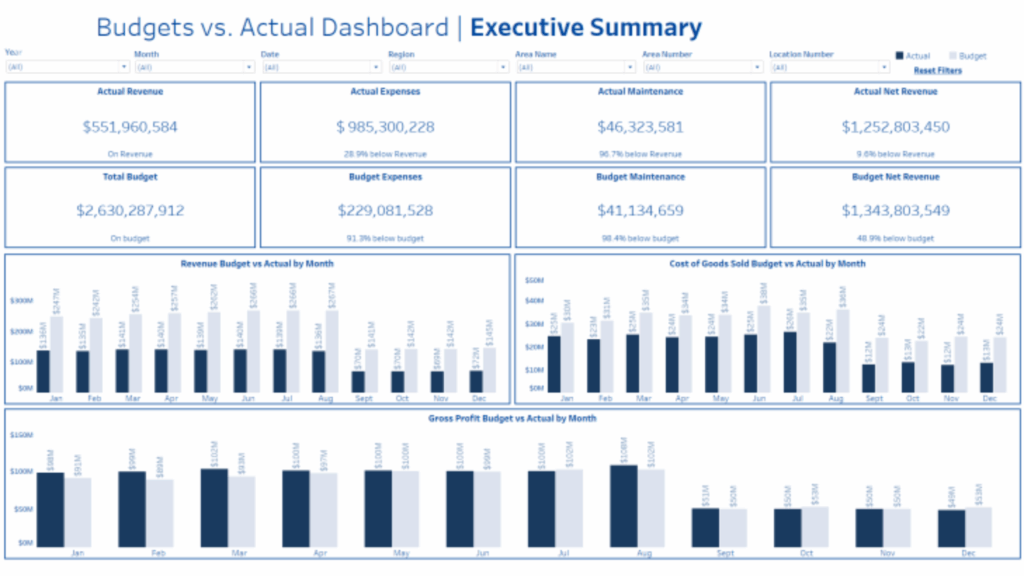
Core Value Proposition: Provide executives with real-time visibility into Budgets vs Actuals for financial control.
- Deliver transparency into revenue, expenses, maintenance, and net revenue.
- Enable regional drilldowns and monthly variance analysis.
- Empower leadership to monitor budget adherence and cost efficiency.
Strategic Objectives:
Problem Statement & Our Solution
The dashboard unified budget and actual data, with variance KPIs, monthly comparisons, and visual alerts on deviations. Executives can slice by region, location, and timeframe.
Team Structure
Technology Stack
Outcomes
Procurement Dashboard
Overview & Strategic Context
Client/Product: US Based – Healthcare
Domain: Analytics & Business Intelligence
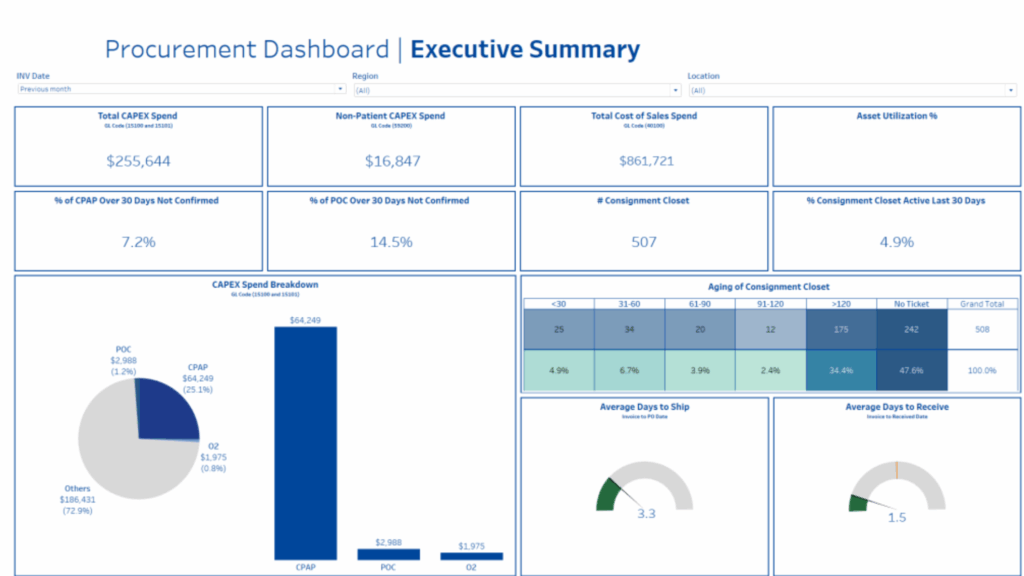
Core Value Proposition : Track CAPEX, cost of sales, and consignment inventory utilization for
optimized procurement decisions.
Strategic Objectives:
- Increase visibility into procurement spend and supplier performance.
- Highlight delays in shipping, receiving, and invoicing.
- Improve CAPEX oversight and asset utilization.
Problem Statement & Our Solution
The dashboard integrates Snowflake procurement data with Tableau, displaying spend breakdown, vendor KPIs, and order aging. Drilldowns allow analysis by supplier, region, and product category.
Team Structure
Technology Stack
- Frontend : Tableau Desktop, Tableau Online, Excel, PowerPoint
- Backend & APIs: SQL queries, Snowflake integrations
- Databases: Snowflake cloud data warehouse
- Recommendation Engine: KPI-driven benchmarking, variance analysis
- Infrastructure: Tableau Server, automated data refresh, scheduling
- Security: Role-based access, SSL connections, governance policies
Outcomes
Humana SLA Dashboard
Overview & Strategic Context
Client/Product: US Based – Healthcare
Domain: Analytics & Business Intelligence
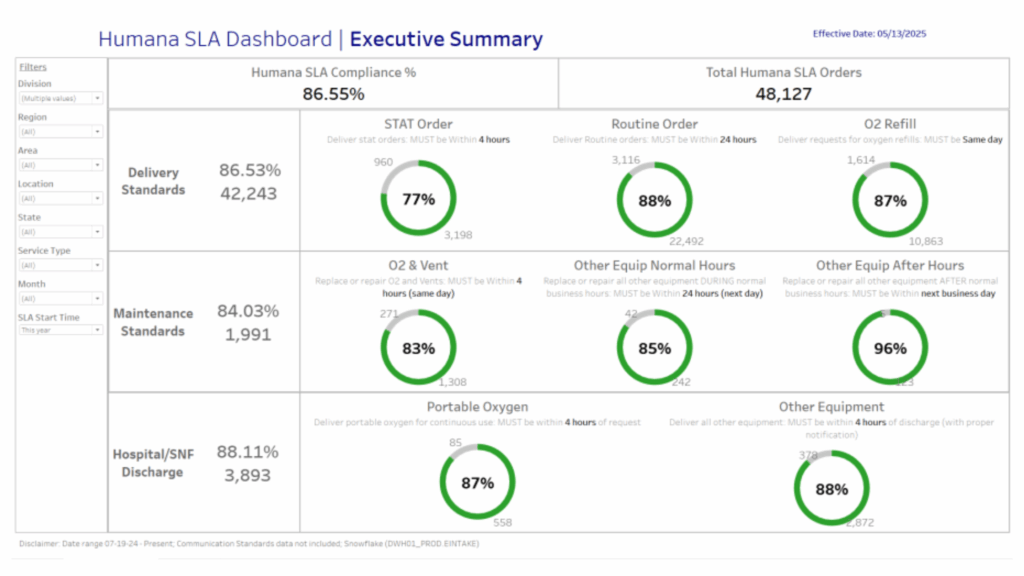
Core Value Proposition : Measure service-level performance across delivery, maintenance, and discharge support standards.
Strategic Objectives:
- Ensure SLA compliance across 8 operational standards.
- Provide leadership with actionable SLA metrics by division and region
- Replace static SLA reports with interactive real-time dashboards.
Problem Statement & Our Solution
The client struggled to track SLA compliance consistently across multiple service categories, relying on manual PowerPoint updates.
The dashboard automated SLA reporting, integrating Snowflake as a data source and Tableau for visual KPI delivery. Filters enable SLA visibility across regions, divisions, and service types.
Team Structure
Technology Stack
- Frontend : Tableau Desktop, Tableau Online, Excel, PowerPoint
- Backend & APIs:SQL queries, Snowflake integrations
- Databases: Snowflake cloud data warehouse
- Recommendation Engine: KPI-driven benchmarking, variance analysis
- Infrastructure: Tableau Server, automated data refresh, scheduling
- Security: Role-based access, SSL connections, governance policies
Outcomes
Earned Units BvA Dashboard
Overview & Strategic Context
Client/Product: US Based – Healthcare
Domain: Analytics & Business Intelligence
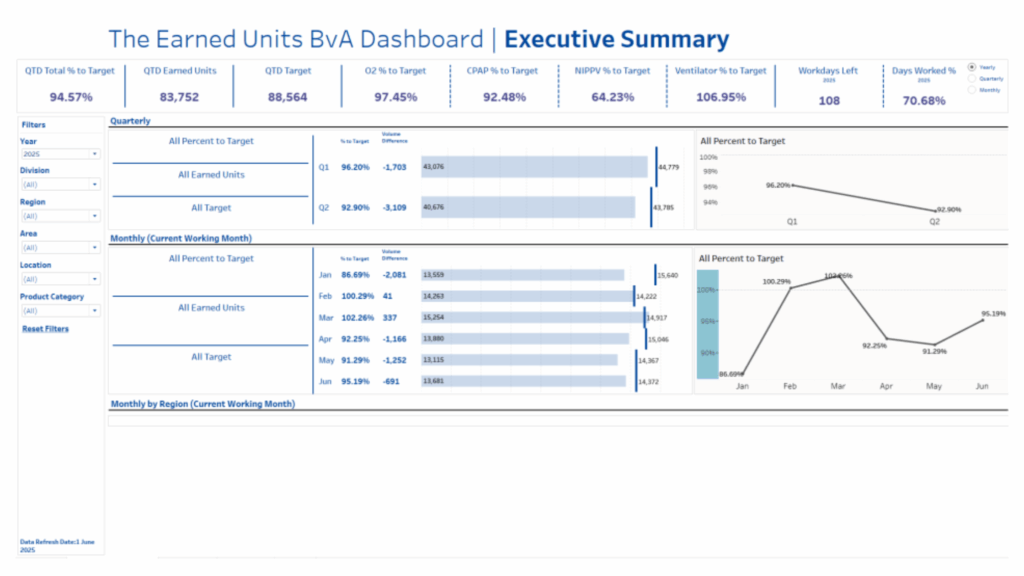
Core Value Proposition : Monitor earned medical equipment units against defined targets for business performance tracking.
Strategic Objectives:
- Compare earned units vs. targets across O2, CPAP, NIPPV, and ventilators.
- Provide monthly, quarterly, and yearly performance insights.
- Enable leadership to detect and address underperformance.
Problem Statement & Our Solution
Leaders lacked timely visibility into unit achievement by product and region, making it difficult to assess performance against targets.
The Tableau dashboard consolidated earned unit KPIs from Snowflake, enabling target vs. actual monitoring with detailed variance analysis.
Team Structure
Technology Stack
- Frontend : Tableau Desktop, Tableau Online, Excel, PowerPoint
- Backend & APIs:SQL queries, Snowflake integrations
- Databases: Snowflake cloud data warehouse
- Recommendation Engine: KPI-driven benchmarking, variance analysis
- Infrastructure: Tableau Server, automated data refresh, scheduling
- Security: Role-based access, SSL connections, governance policies
Outcomes
Executive AR Snapshot Dashboard
Overview & Strategic Context
Client/Product: US Based – Healthcare
Domain: Analytics & Business Intelligence
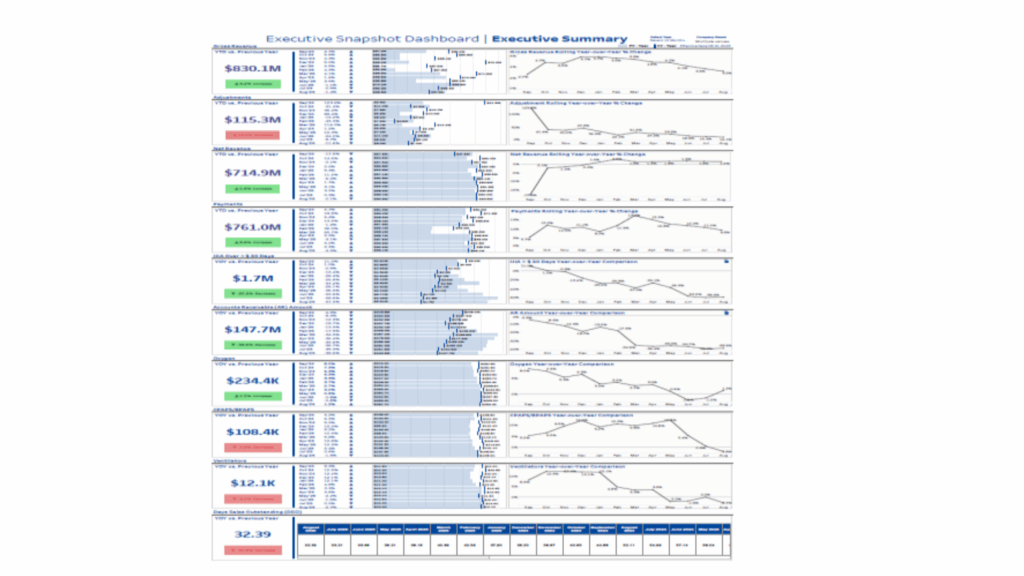
Core Value Proposition : Deliver executive-level insights into accounts receivable (AR) performance
and financial health.
Strategic Objectives:
- Monitor gross and net revenue, adjustments, and payments with YOY comparisons.
- Improve visibility into overdue AR and Days Sales Outstanding (DSO).
- Support cash flow planning and receivable risk management.
Problem Statement & Our Solution
The AR Snapshot Dashboard provided a consolidated executive view, including gross revenue growth, net revenue fluctuations, and overdue account aging. It highlighted AR risk and improved oversight.
Team Structure
Technology Stack
- Frontend : Tableau Desktop, Tableau Online, Excel, PowerPoint
- Backend & APIs:SQL queries, Snowflake integrations
- Databases: Snowflake cloud data warehouse
- Recommendation Engine: KPI-driven benchmarking, variance analysis
- Infrastructure: Tableau Server, automated data refresh, scheduling
- Security: Role-based access, SSL connections, governance policies
Outcomes
Let’s turn your data into decisions.
Need a custom BI or AI dashboard? Get a free consultation with our data experts